
Finding the depot behind the late deliveries
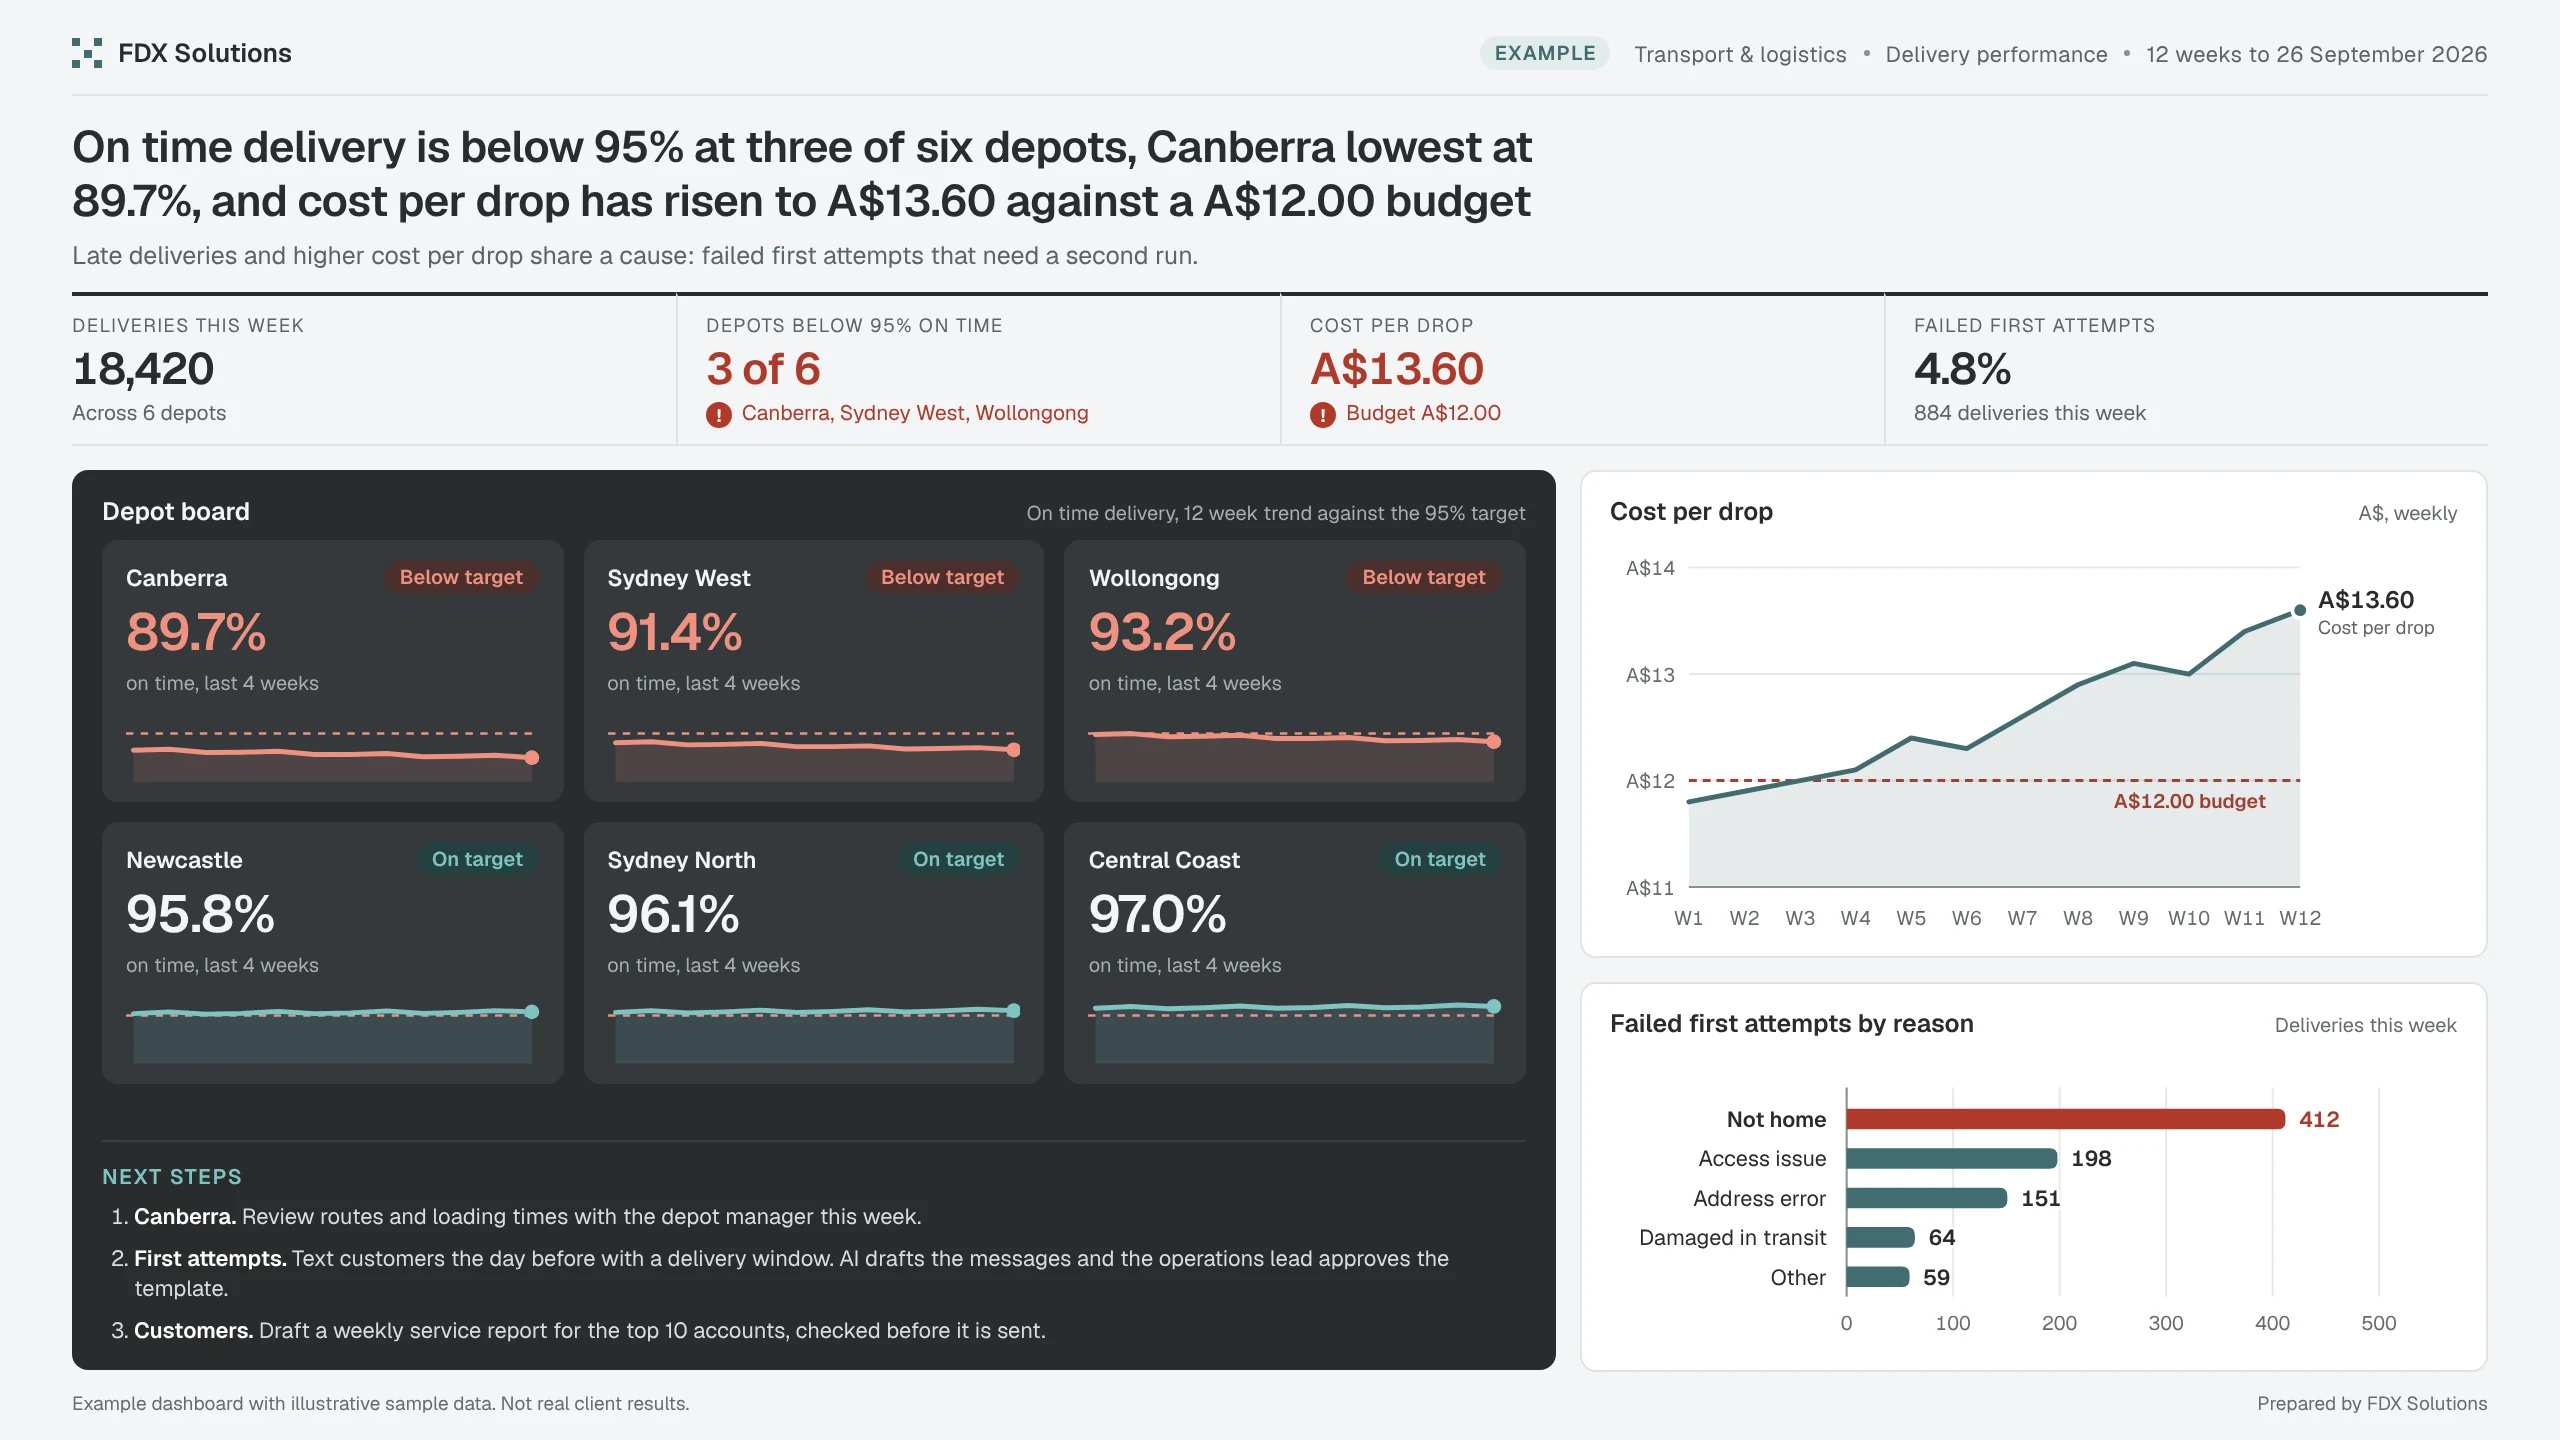
A weekly view of on time delivery by depot and cost per drop, so operations can find the depots that need attention and the cause behind the cost.
- 18,420Deliveries this weekAcross 6 depots
- 3 of 6Depots below 95% on timeCanberra, Sydney West, Wollongong
- A$13.60Cost per dropBudget A$12.00
- 4.8%Failed first attempts884 deliveries this week
The problem
A logistics operator reported on time performance as one network number. When it slipped, nobody could see which depot or route was behind it, or why cost per drop was rising.
What the numbers say
Late deliveries and higher cost per drop share a cause: failed first attempts that need a second run.
How FDX uses it
- 01Connect the dataWe connect the transport management system, proof of delivery data and costs into one model, refreshed daily.
- 02Draft, then approveAI drafts customer notifications, exception summaries and account reports. The operations lead approves them.
- 03Keep it privateCustomer names and addresses are masked before any AI model sees them, and the data is not used for training.
Next steps it points to
- CanberraReview routes and loading times with the depot manager this week.
- First attemptsText customers the day before with a delivery window. AI drafts the messages and the operations lead approves the template.
- CustomersDraft a weekly service report for the top 10 accounts, checked before it is sent.
ExampleExample case study with illustrative sample data. Not a real client or real results.
Next exampleHealthShorter waits by filling the slots that were already there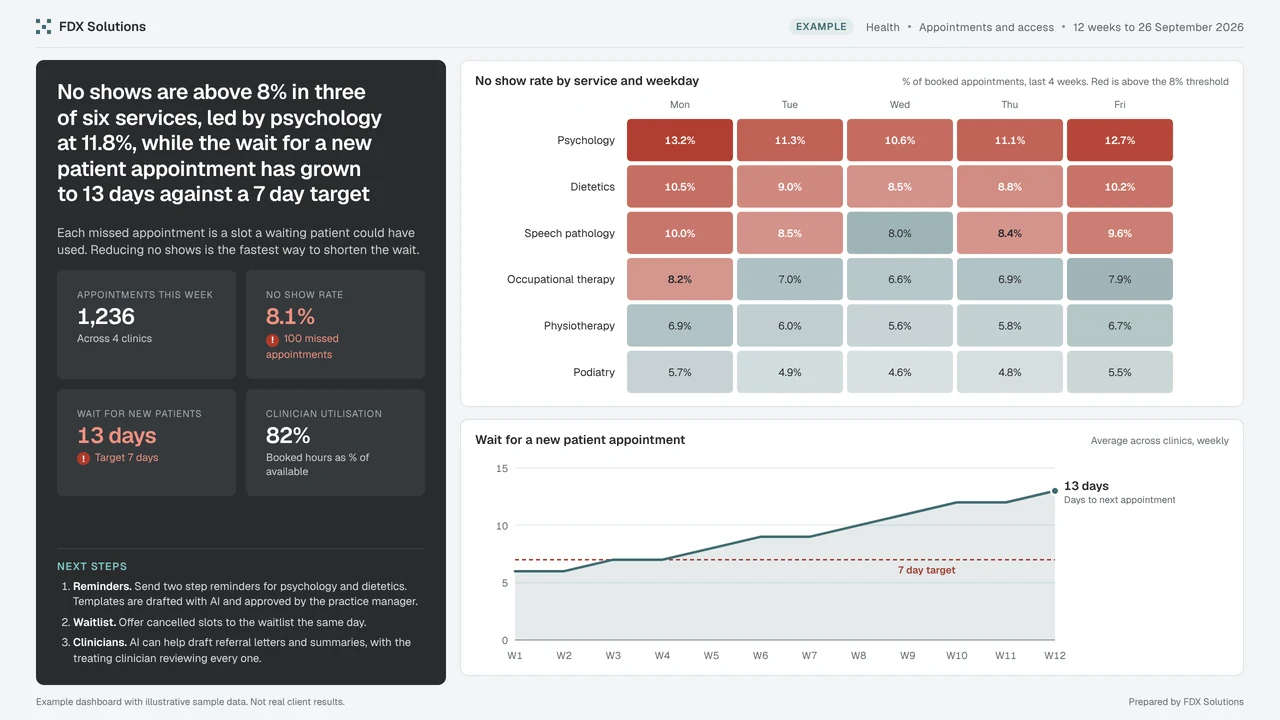
The dashboard is one part of the work.
It gives the team one trusted view of the numbers. The bigger gain is AI working from that same data to draft the follow ups, with a person approving every step.
When AI drafts from your data, personal details are masked before the model sees them. Onshore hosting is available, and your data is not used for training.