
Knowing in week 13, not week 19, whether the deadline is at risk
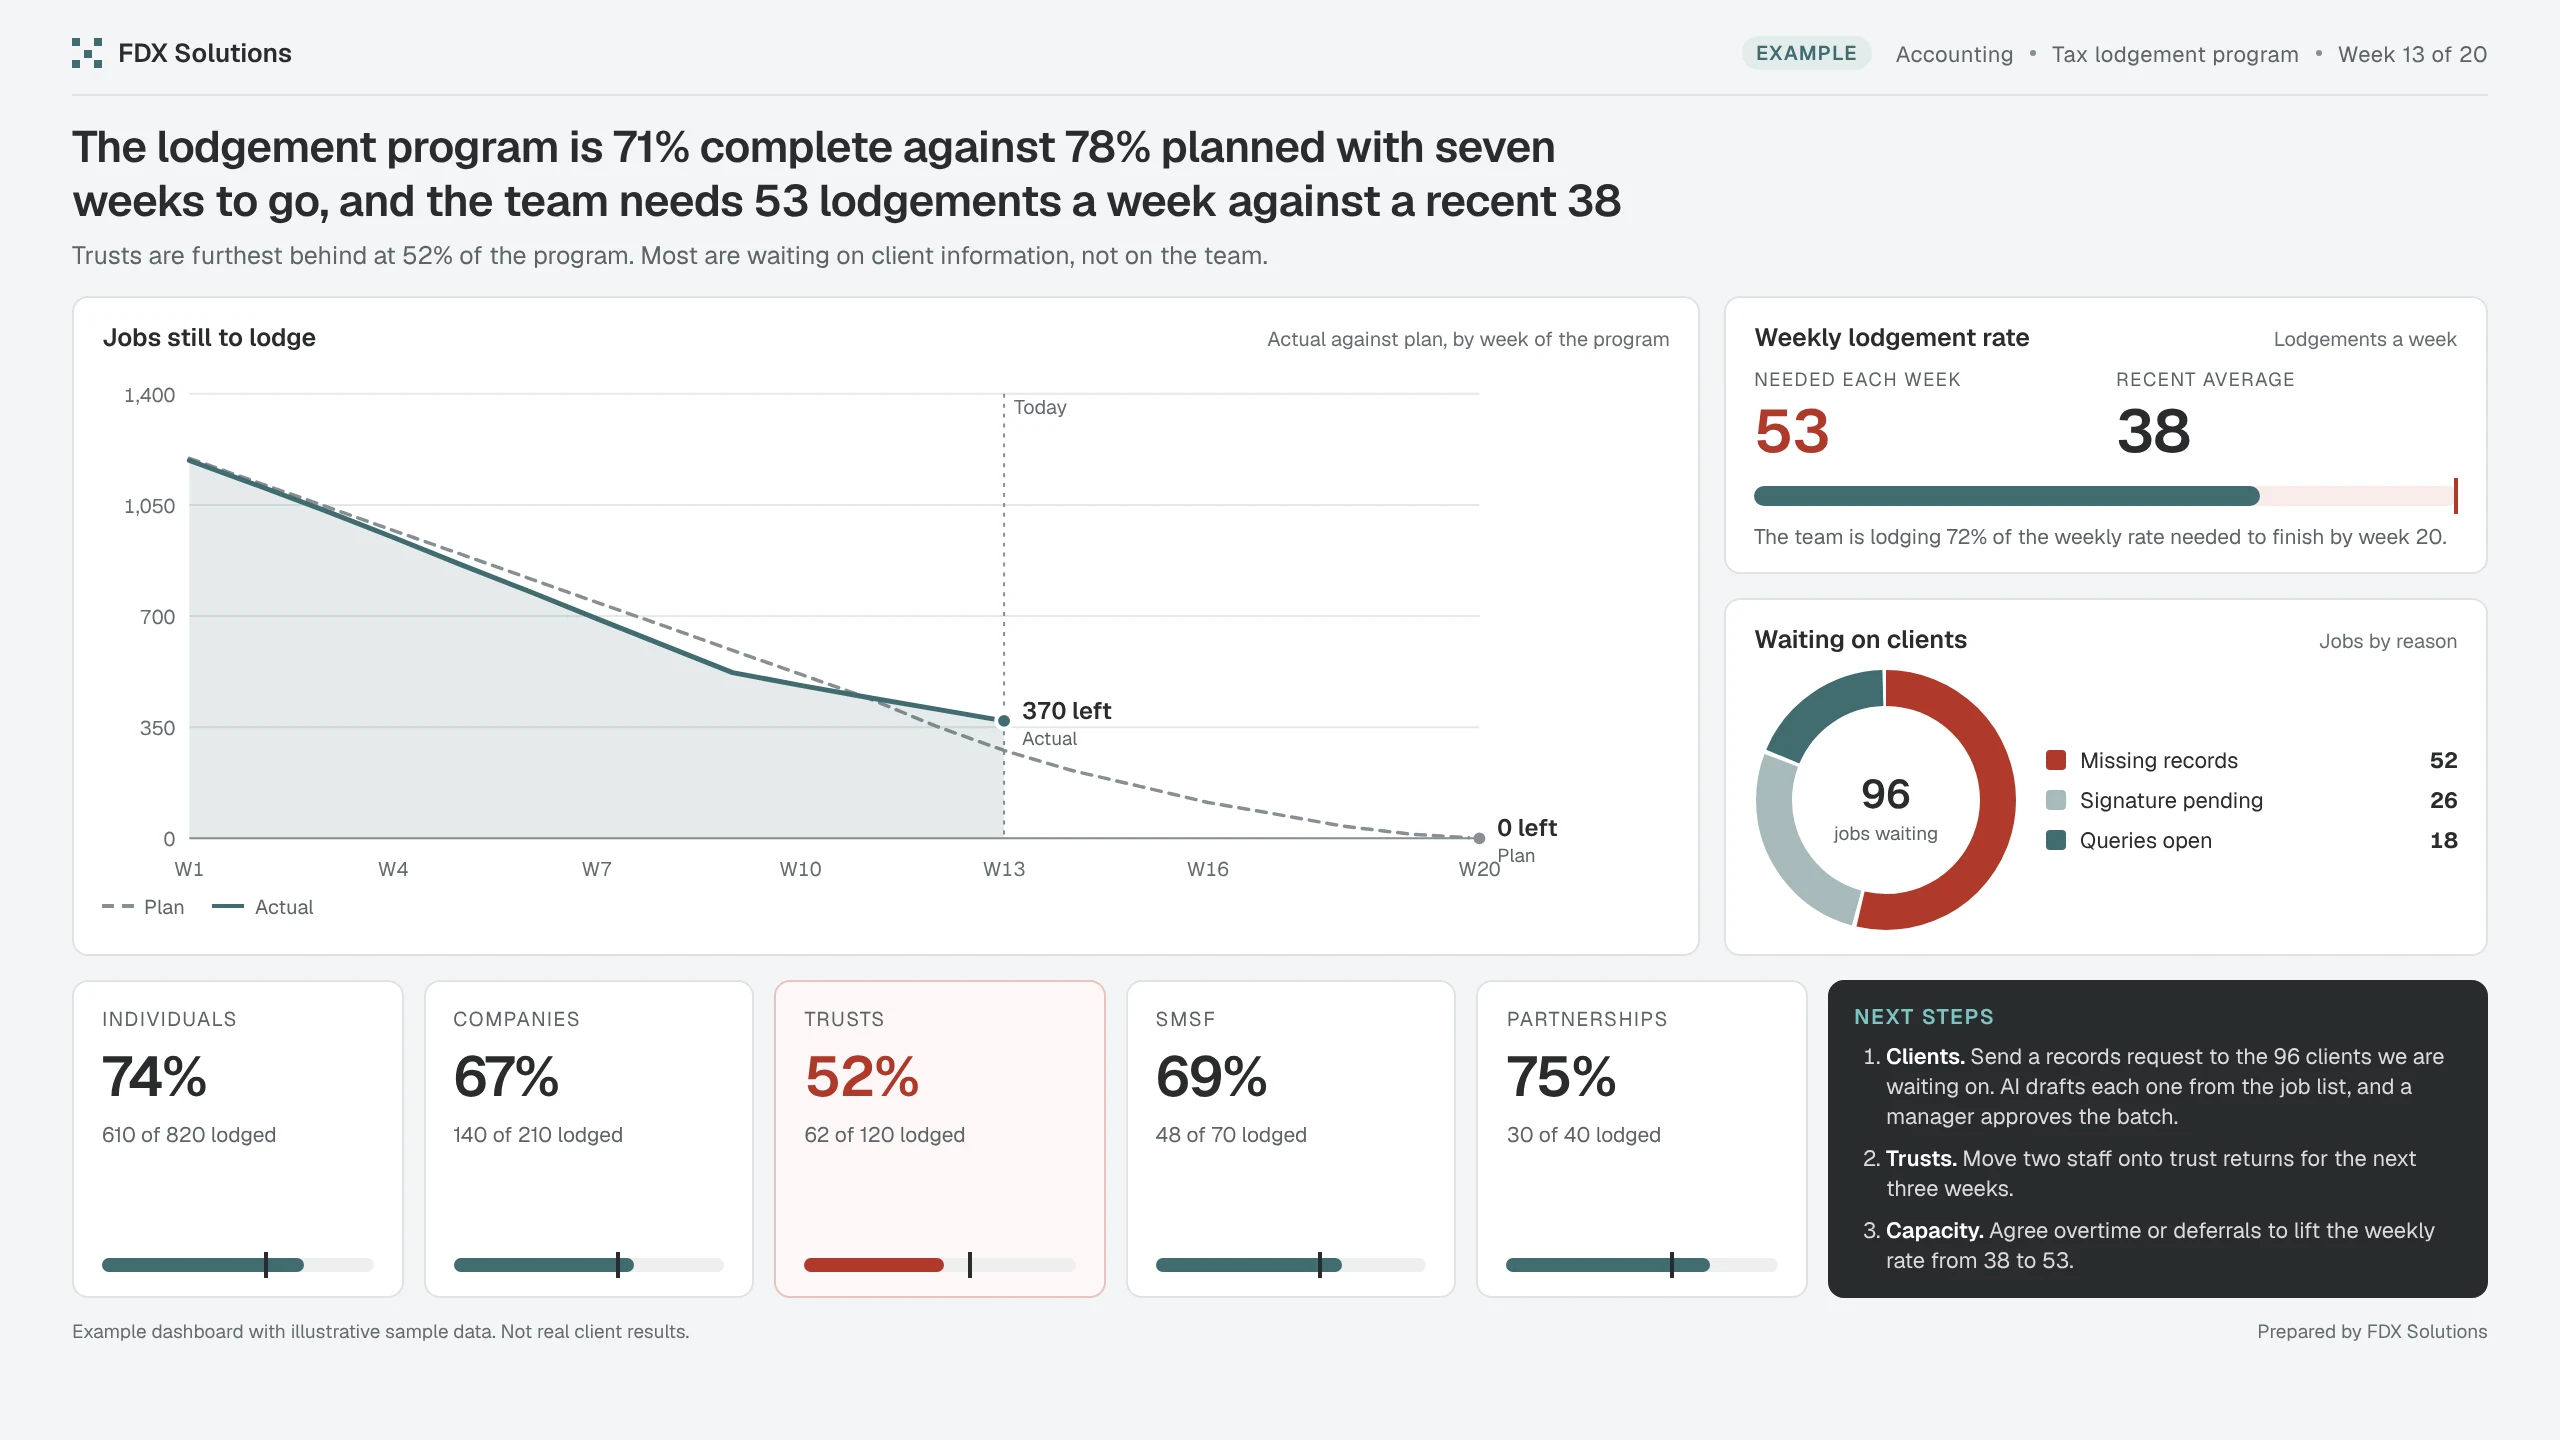
A weekly lodgement program view: what is done, what is left, the rate the team needs to finish, and which client types are falling behind.
- 890 of 1,260Lodged to date71% complete
- -7 ptsAgainst planPlan is 78% by week 13
- 53Weekly rate neededRecent average 38 a week
- 96 jobsWaiting on clientsRecords requested over 14 days ago
The problem
A practice tracked tax season in a shared spreadsheet that was only updated on Fridays. Partners could not tell how far behind the program was or which jobs were stuck waiting on clients.
What the numbers say
Trusts are furthest behind at 52% of the program. Most are waiting on client information, not on the team.
How FDX uses it
Three steps, with a person in charge
Next steps it points to
- ClientsSend a records request to the 96 clients we are waiting on. AI drafts each one from the job list, and a manager approves the batch.
- TrustsMove two staff onto trust returns for the next three weeks.
- CapacityAgree overtime or deferrals to lift the weekly rate from 38 to 53.
ExampleExample case study with illustrative sample data. Not a real client or real results.
Next exampleFinanceSeeing where loans stall before the client does
The dashboard is one part of the work.
It gives the team one trusted view of the numbers. The bigger gain is AI working from that same data to draft the follow ups, with a person approving every step.
When AI drafts from your data, personal details are masked before the model sees them. Onshore hosting is available, and your data is not used for training.