
Stopping scope creep from quietly eating the fee
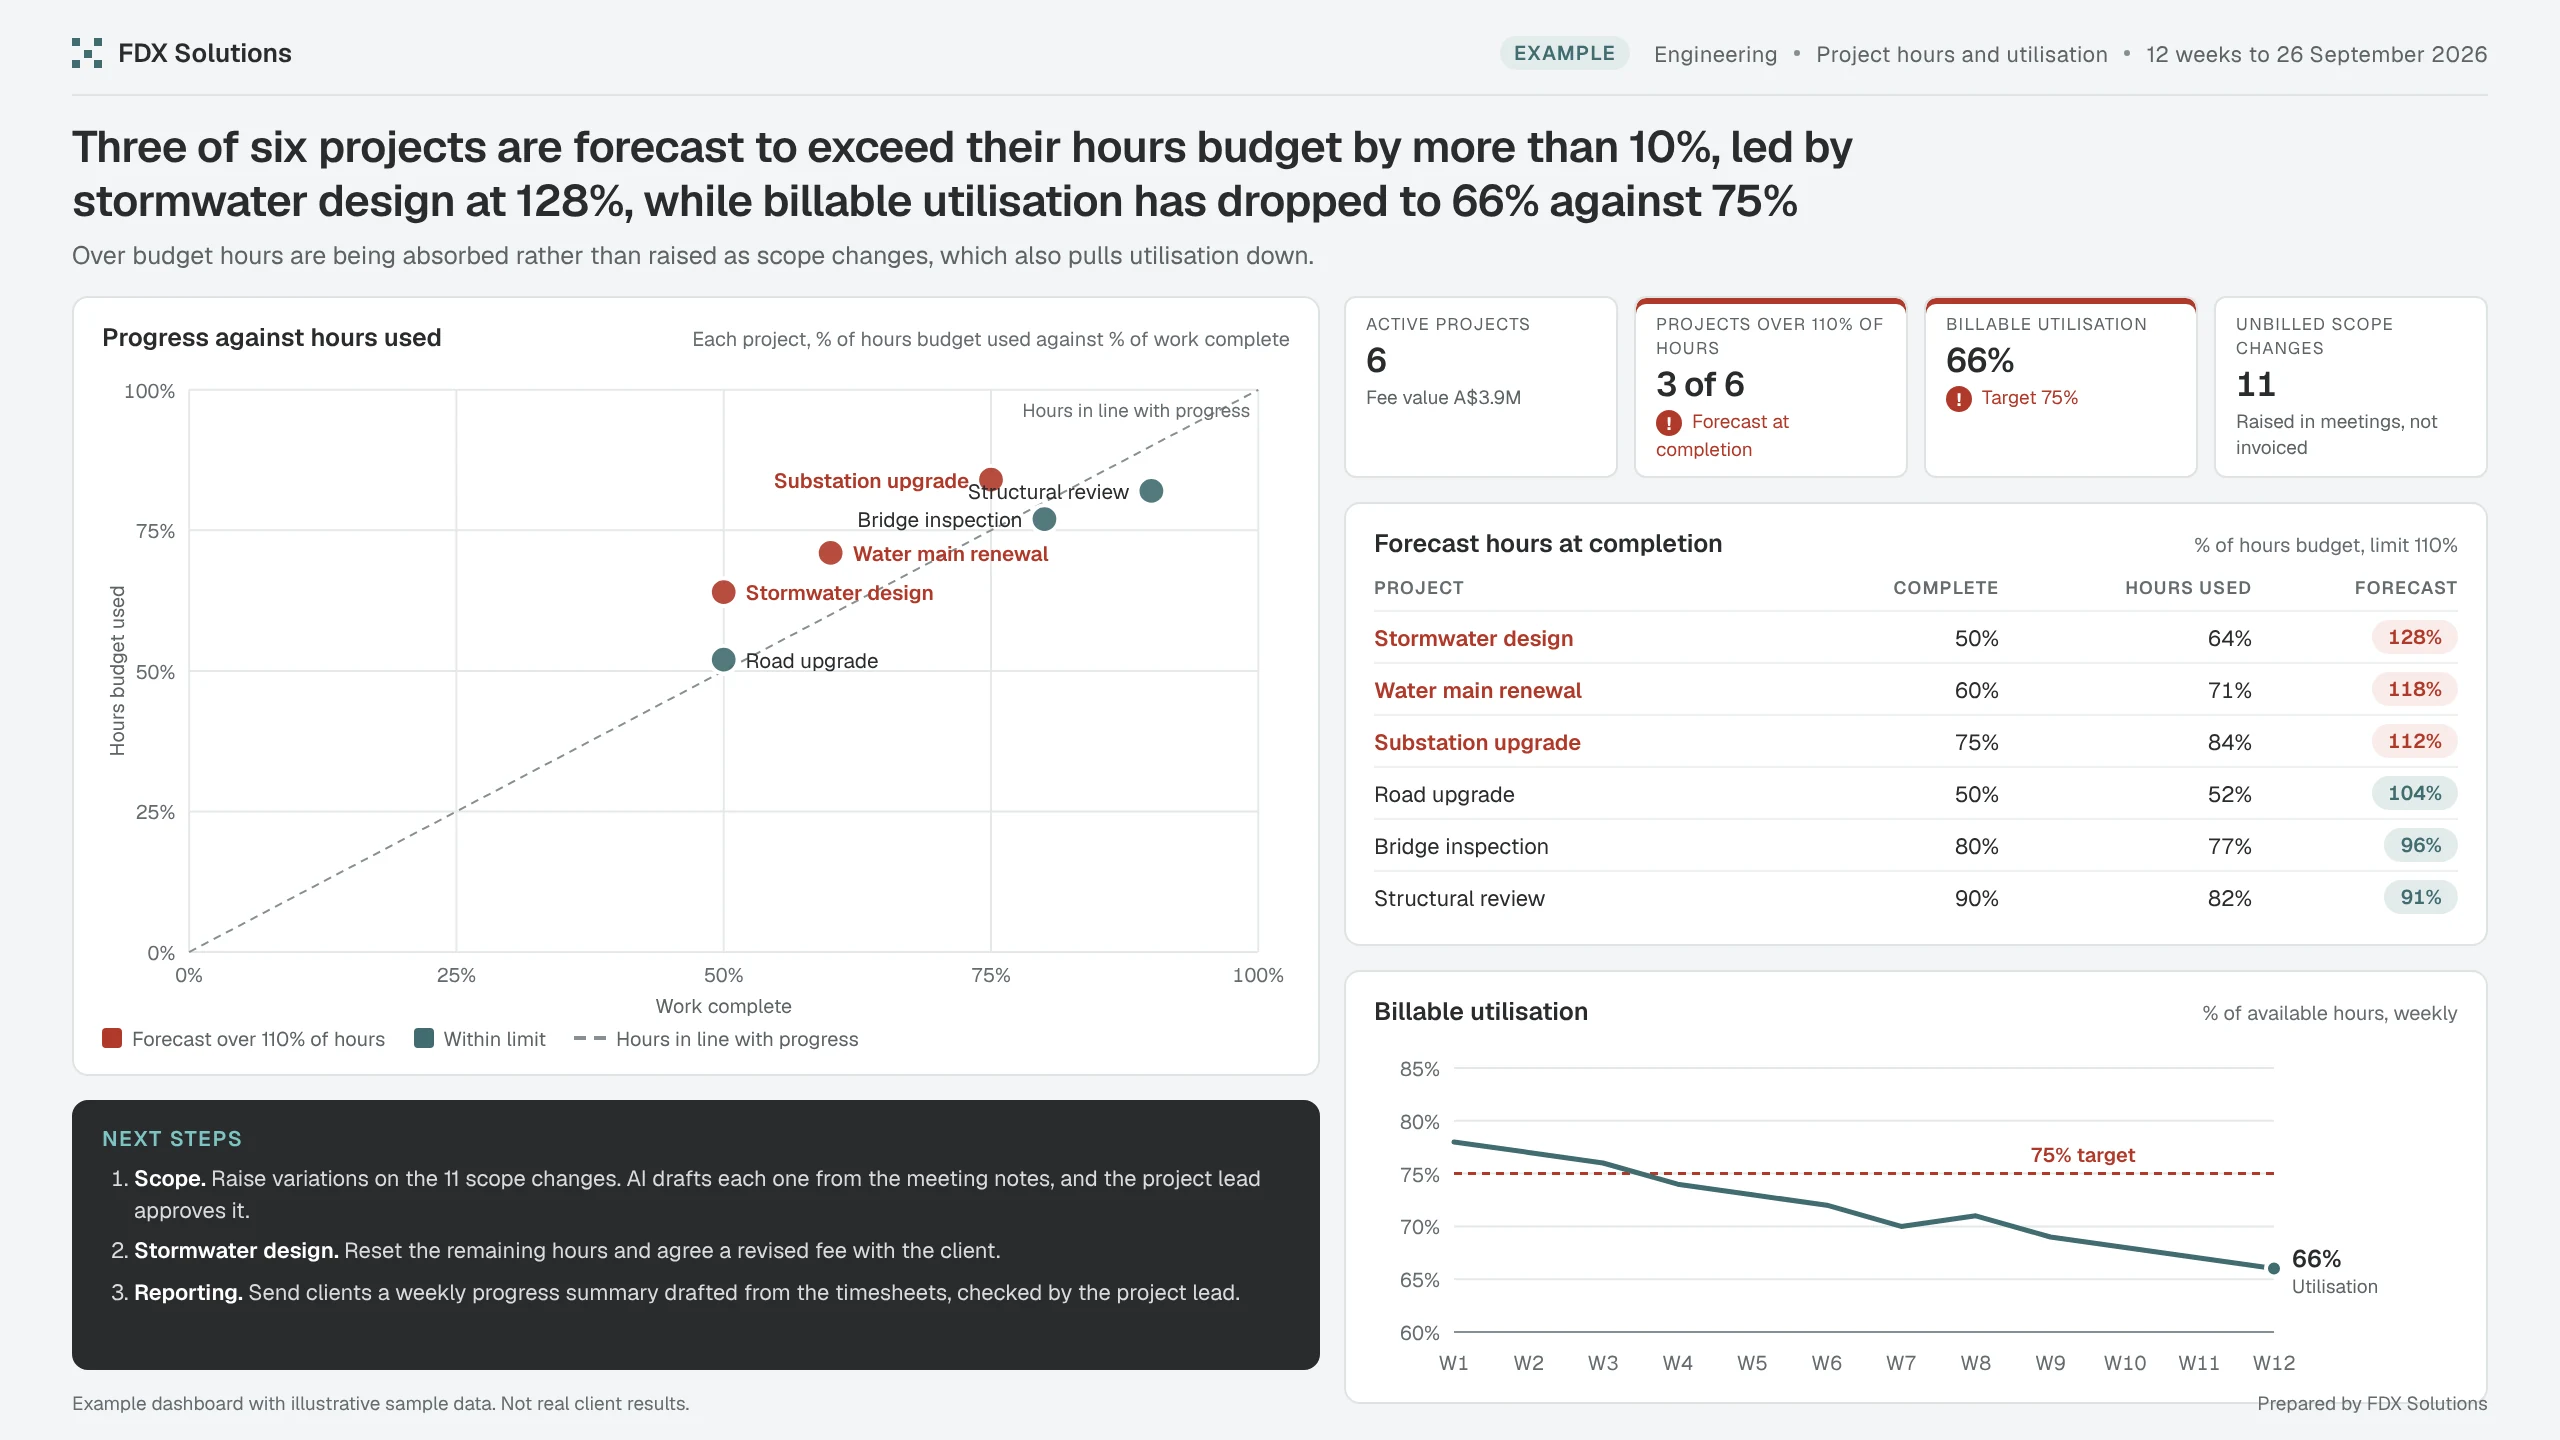
A weekly view of forecast hours against budget for every project, next to team utilisation, so project leads can raise scope changes while they are still billable.
01The problem
An engineering consultancy knew projects were running over, but only after timesheets were closed. Small scope changes agreed in meetings were never invoiced.
02What the numbers say
Over budget hours are being absorbed rather than raised as scope changes, which also pulls utilisation down.
- Active projects6Fee value A$3.9M
- Projects over 110% of hours3 of 6Forecast at completion
- Billable utilisation66%Target 75%
- Unbilled scope changes11Raised in meetings, not invoiced
03How FDX uses it
- We connect timesheets, the project register and fee data into one model, refreshed daily.
- AI turns meeting notes into draft variations and client updates. The project lead reviews and sends them.
- Client and project data stays inside approved tools, with onshore hosting available, and it is not used for training.
Next steps it points to
- ScopeRaise variations on the 11 scope changes. AI drafts each one from the meeting notes, and the project lead approves it.
- Stormwater designReset the remaining hours and agree a revised fee with the client.
- ReportingSend clients a weekly progress summary drafted from the timesheets, checked by the project lead.
ExampleExample case study with illustrative sample data. Not a real client or real results.
Next exampleTransport & logisticsFinding the depot behind the late deliveries
The dashboard is one part of the work.
It gives the team one trusted view of the numbers. The bigger gain is AI working from that same data to draft the follow ups, with a person approving every step.
When AI drafts from your data, personal details are masked before the model sees them. Onshore hosting is available, and your data is not used for training.