
One version of the capital program everyone can trust
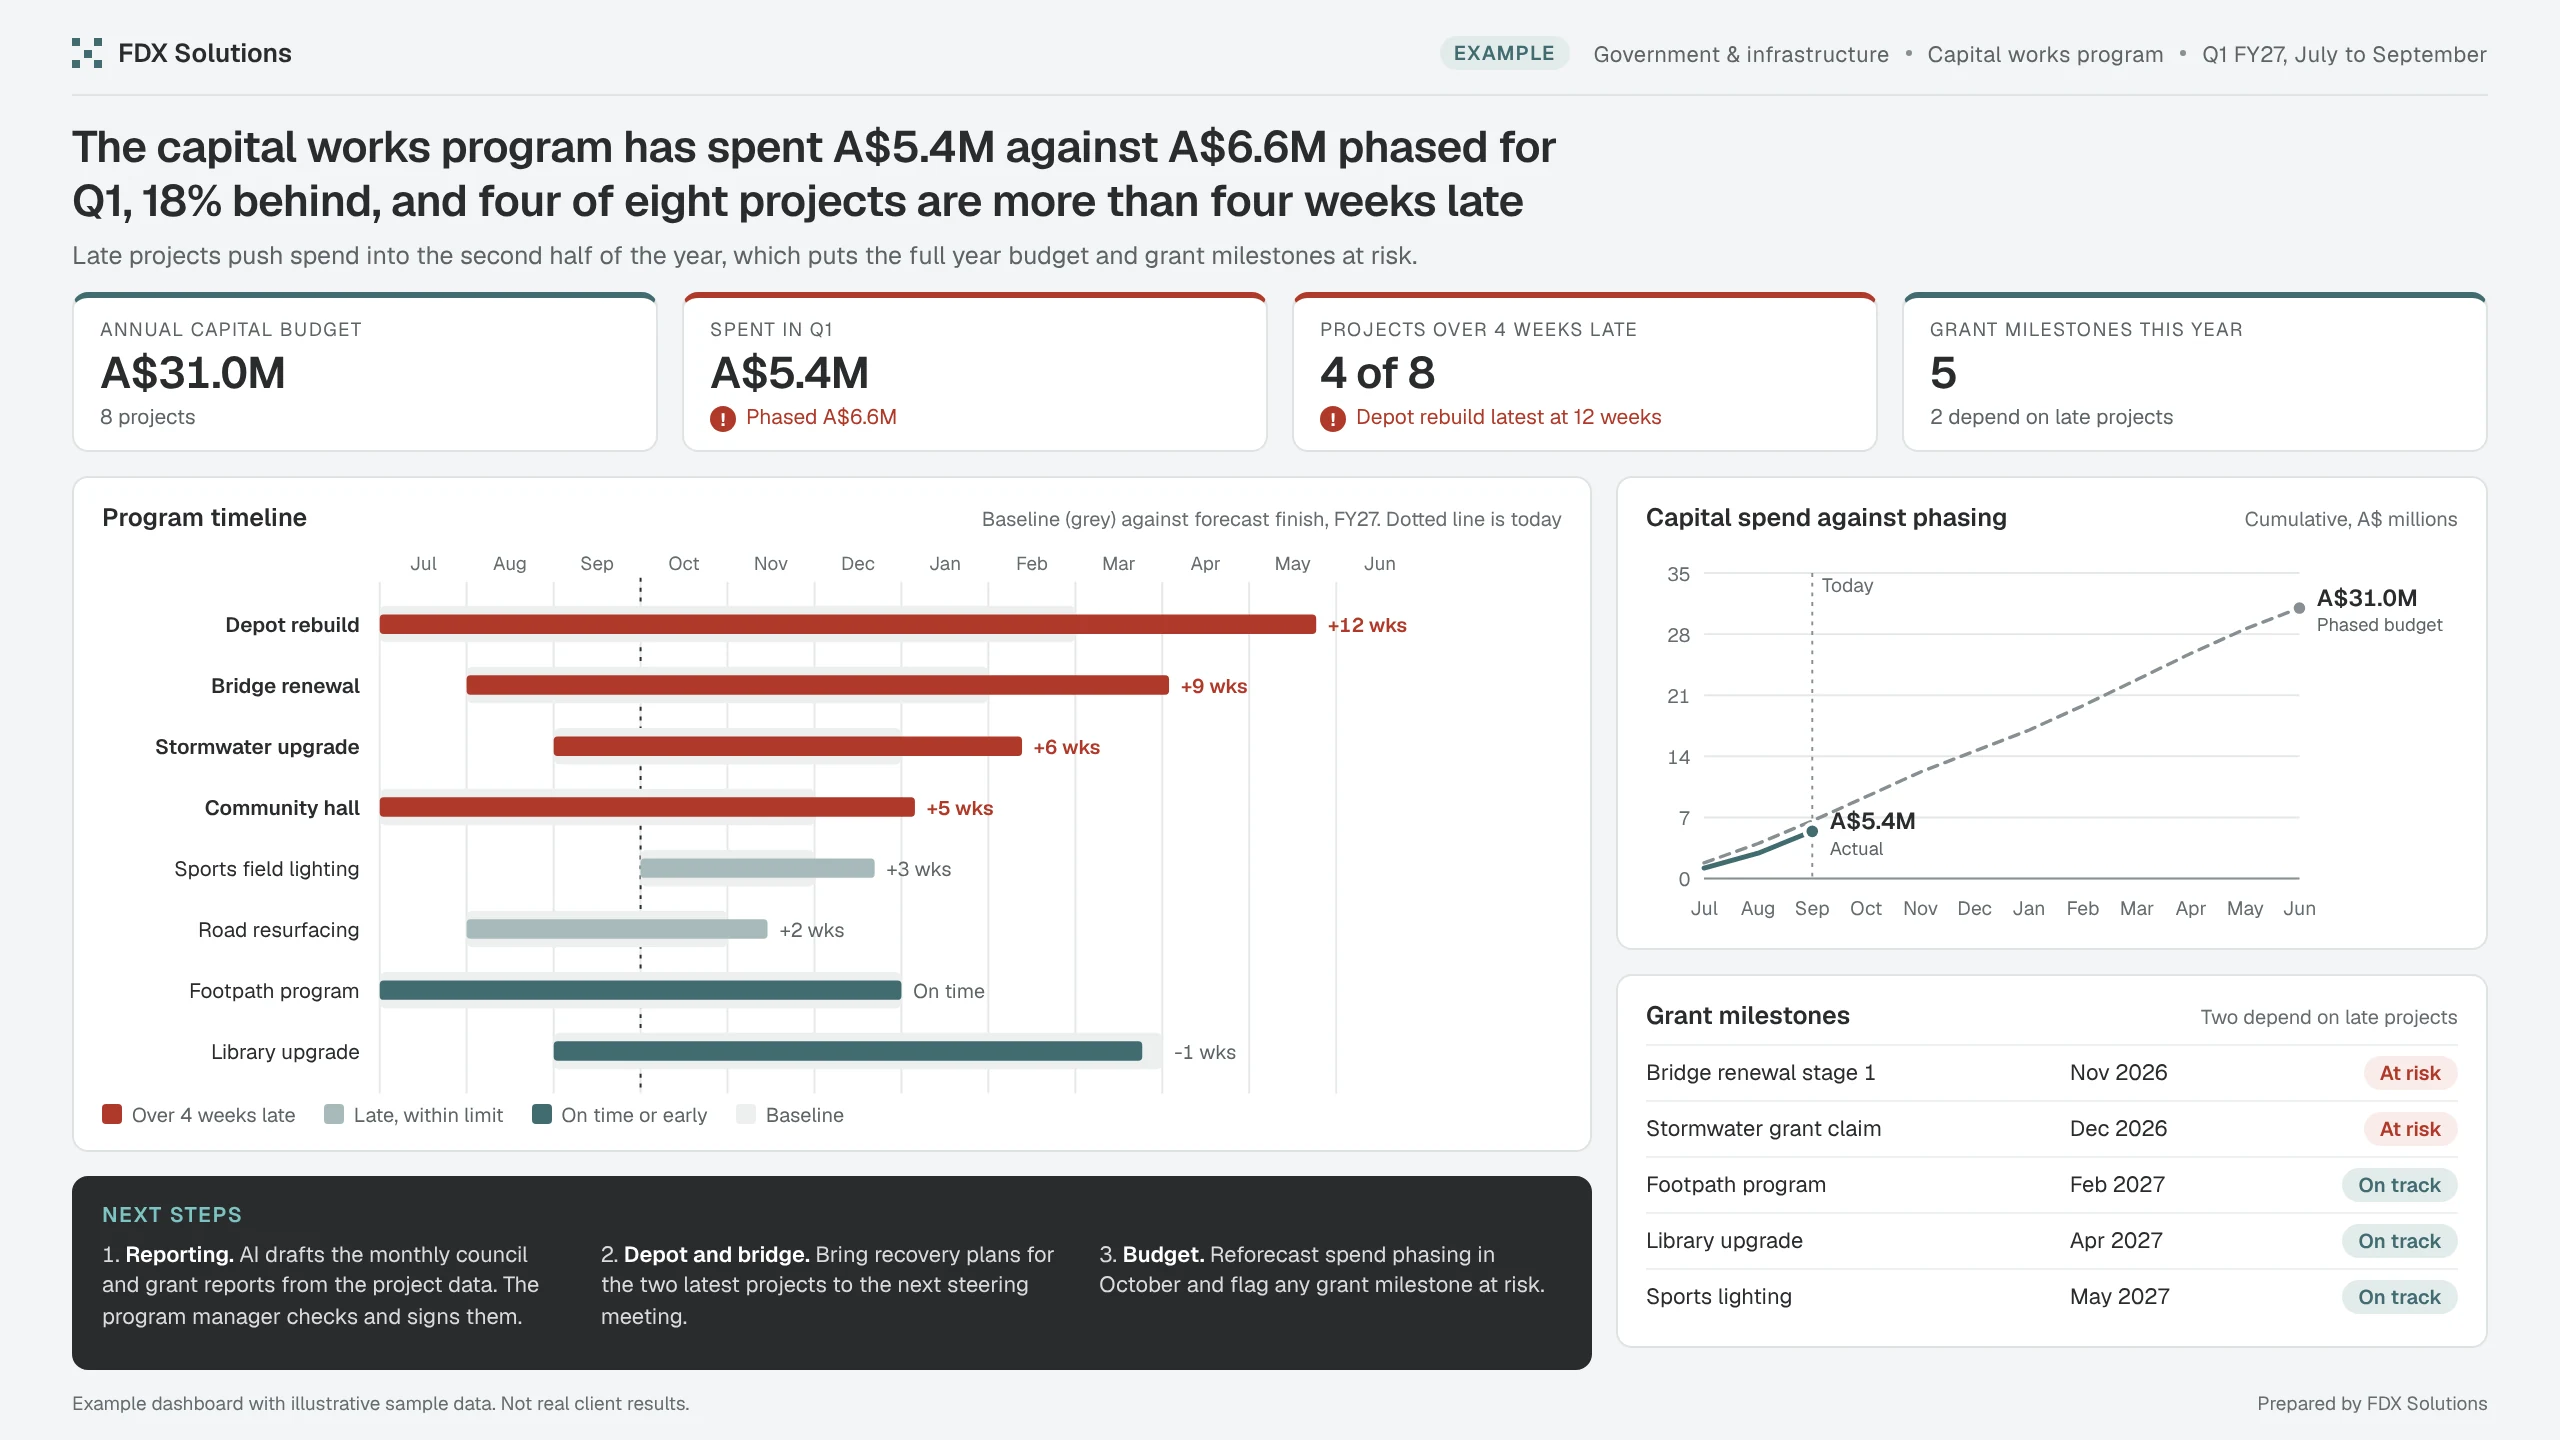
A monthly view of spend against phasing and schedule variance for every project, so the program manager and executive see the same numbers.
The problem
A council's capital program lived in project managers' spreadsheets and the finance system, with different numbers in each. Monthly reports took days to compile and were out of date when tabled.
What the numbers say
Late projects push spend into the second half of the year, which puts the full year budget and grant milestones at risk.
- Annual capital budgetA$31.0M8 projects
- Spent in Q1A$5.4MPhased A$6.6M
- Projects over 4 weeks late4 of 8Depot rebuild latest at 12 weeks
- Grant milestones this year52 depend on late projects
How FDX uses it
- 01Connect the data
We connect the finance system and project schedules into one model, refreshed weekly.
- 02Draft, then approve
AI drafts council papers and grant reports from approved project data. Officers review and sign off every report.
- 03Keep it private
Data stays inside approved tools, with onshore hosting available, and it is not used to train AI models.
- 01Connect the data
Next steps it points to
- ReportingAI drafts the monthly council and grant reports from the project data. The program manager checks and signs them.
- Depot and bridgeBring recovery plans for the two latest projects to the next steering meeting.
- BudgetReforecast spend phasing in October and flag any grant milestone at risk.
ExampleExample case study with illustrative sample data. Not a real client or real results.
Next exampleMediaLinking what the audience reads to what advertisers buy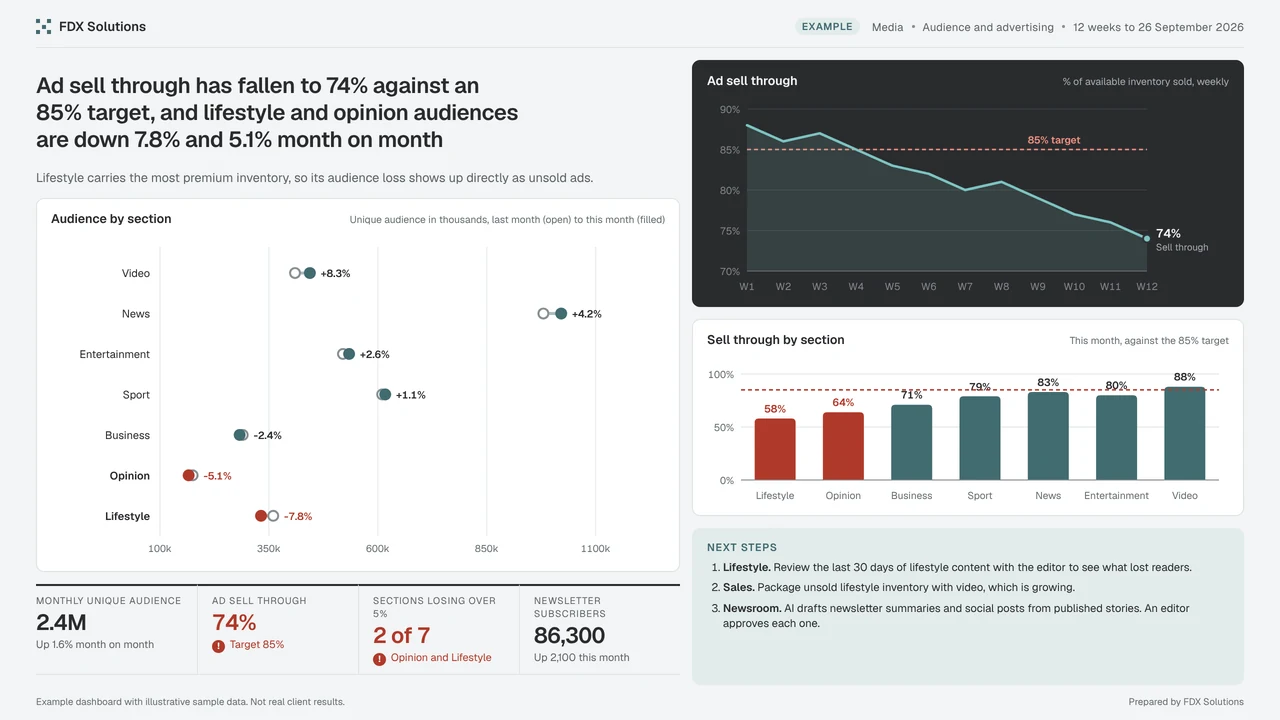
The dashboard is one part of the work.
It gives the team one trusted view of the numbers. The bigger gain is AI working from that same data to draft the follow ups, with a person approving every step.
When AI drafts from your data, personal details are masked before the model sees them. Onshore hosting is available, and your data is not used for training.